
New: power use graphs
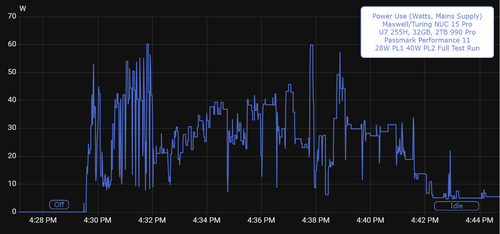
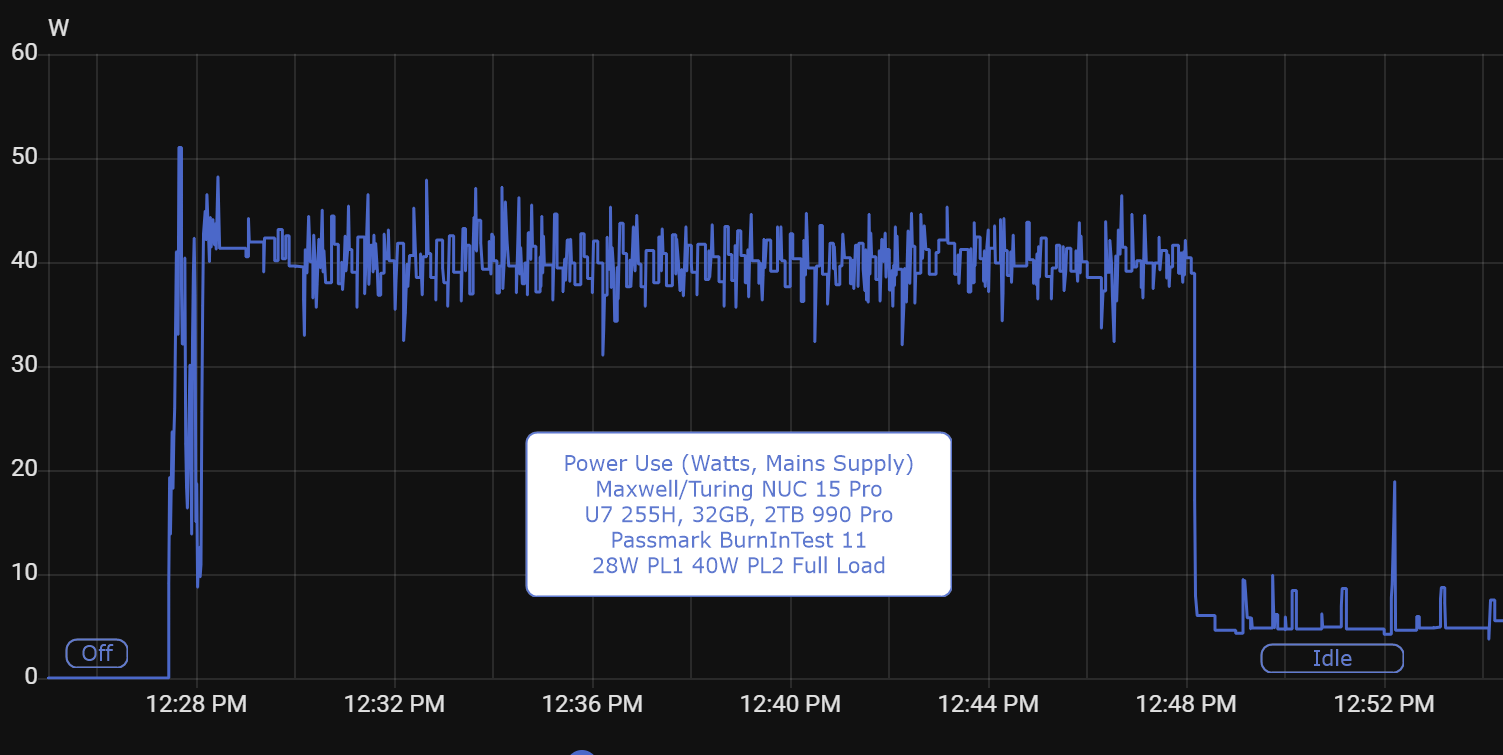
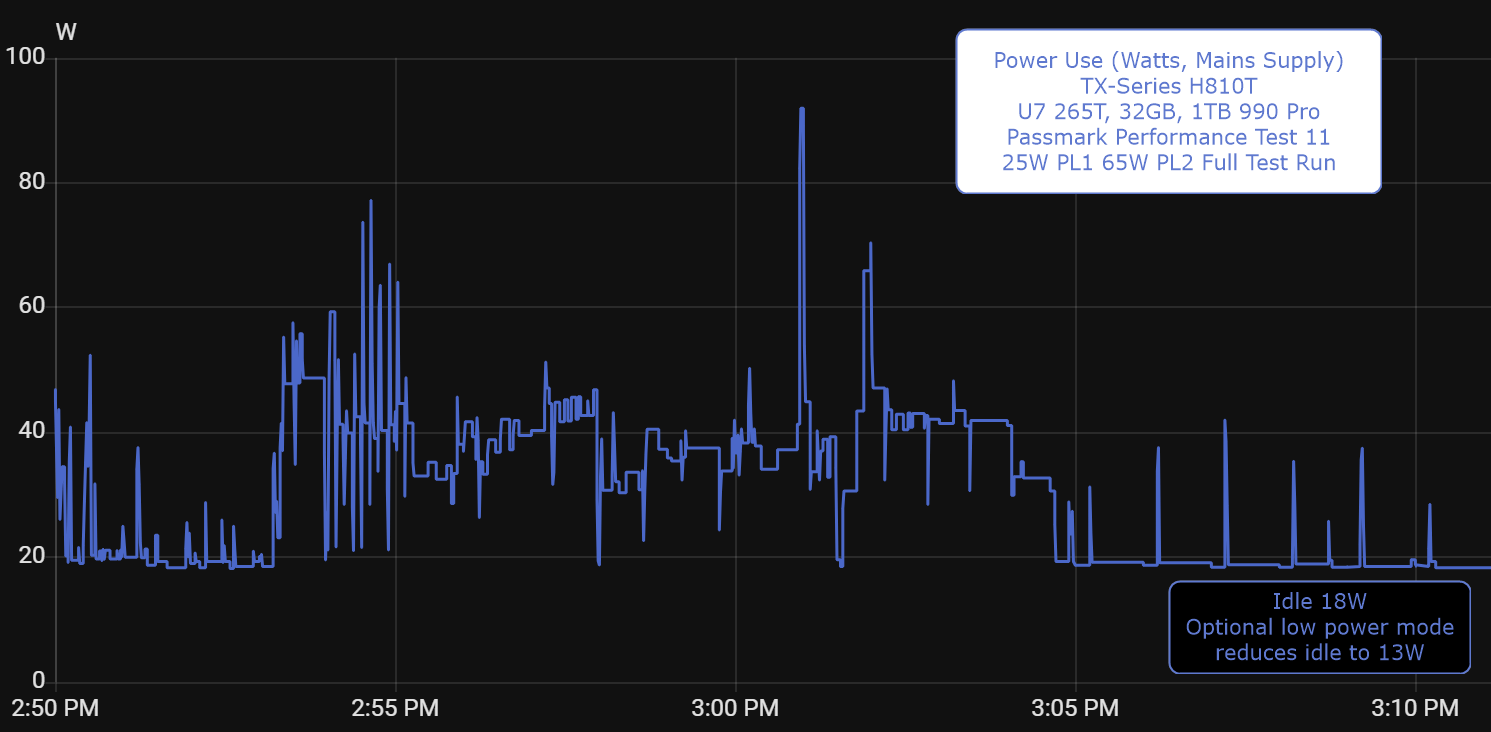
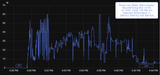
We are now including power use graphs with our product listings. These show the power, in Watts, drawn from the mains power supply. For each product we measure the power used while performing the sequence of PassMark Performance Tests, and during a fully loaded run of PassMark BurnInTest. These are all performed using Windows 11 Pro.
From these graphs you can see the spikes in power from turbo-boosted operations, as well as the long-term power draw from constant heavy load. They also show the idle power draw after the test completes and Windows 11 is just displaying the desktop.
Some examples are shown below. They will be added to all our product listings over the coming weeks.
10th Feb 2026
Recent Posts
-

Great value fanless PCs with Intel Core i5, back in stock
We now have great value offerings with the 14th Gen Intel Core i5 14400T processor. Available in eit …24th Sep 2026 -
New optional pedestal feet for TX-Series Fanless PCs
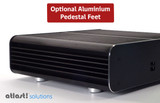
TX-Series Fanless PCs now offer an optional upgrade from standard rubber feet to precision aluminiu …1st Apr 2026 -
New: power use graphs
We are now including power use graphs with our product listings. These show the power, in Watts, dra …10th Feb 2026